Showing posts with label Resources. Show all posts

Sunday, March 16, 2008

Nonlinear Regression *

Nonlinear regression is a method of finding a nonlinear model of the relationship between the dependent variable and a set of independent variables. Unlike traditional linear regression, which is restricted to estimating linear models, nonlinear regression can estimate models with arbitrary relationships between independent and dependent variables. This is accomplished using iterative estimation algorithms. Note that this procedure is not necessary for simple polynomial models of the form Y = A + BX^2. By defining W = X^2, we get a simple linear model, Y = A + BW, which can be estimated using traditional methods such as the Linear Regression procedure.

Implementation

  • Can population be predicted based on time? A scatter plot shows that there seems to be a strong relationship between population and time, but the relationship is nonlinear, so it requires the special estimation methods of the Nonlinear Regression procedure. By setting up an appropriate equation, such as a logistic population growth model, we can get a good estimate of the model, allowing us to make predictions about population for times that were not actually measured.
  • An internet service provider (ISP) is determining the effects of a virus on its networks. As part of this effort, they have tracked the (approximate) percentage of infected e-mail traffic on its networks over time, from the moment of discovery until the threat was contained. We can use Nonlinear Regression to model the rise and decline of the infection.

Linear Regression

Linear regression is used to model the value of a dependent scale variable based on its linear relationship to one or more predictors. It estimates the coefficients of the linear equation, involving one or more independent variables that best predict the value of the dependent variable. For example, you can try to predict a salesperson's total yearly sales (the dependent variable) from independent variables such as age, education, and years of experience.
Implementation

  • An automotive industry group keeps track of the sales for a variety of personal motor vehicles. In an effort to be able to identify over- and underperforming models, you want to establish a relationship between vehicle sales and vehicle characteristics. We can use linear regression to identify models that are not selling well.
  • Is the number of games won by a basketball team in a season related to the average number of points the team scores per game? A scatter plot indicates that these variables are linearly related. The number of games won and the average number of points scored by the opponent are also linearly related. These variables have a negative relationship. As the number of games won increases, the average number of points scored by the opponent decreases. With linear regression, you can model the relationship of these variables. A good model can be used to predict how many games teams will win.
  • The Nambe Mills company has a line of metal tableware products that require a polishing step in the manufacturing process. To help plan the production schedule, the polishing times for 59 products were recorded, along with the product type and the relative sizes of these products, measured in terms of their diameters. We can use linear regression to determine whether the polishing time can be predicted by product size.

Friday, February 22, 2008

Kamus 2.03, Free English-Indonesian and vice versa dictionary ...

Kamus 2.03 merupakan program terjemah Inggris-Indonesia dan sebaliknya. Pada versi ini ada beberapa perbaikan dan tambahan dari versi sebelumnya.

Update Kamus v2.03 :
[*] Perbaikan pencarian jika ada penambahan spasi.
[+] Penambahan informasi (hint), termasuk hasil frase ( sehingga kalimat/kata yang panjang bisa terlihat )
[+] Penambahan opsi apakah otomatis menghapus selain huruf abjad.
[*] Installer tidak akan menghapus database tambahan.


Jika sudah menggunakan program Kamus versi 2.0 sampai 2.02, mungkin anda hanya ingin download updatenya saja ( Kamus2.exe dan help file ), yang relatif kecil ukurannya. Silahkan klik Update Kamus to 2.03

Untuk Download lengkap dengan installernya klik Kamus 2.03 (2.76 MB)

Sunday, February 10, 2008

Ms Excel - Formatting Entries

Formatting

Formatting is anything that changes the appearance of an entry: alignment, number of decimals used to display a number, font typeface, font style (bold, italic, or underlined), font size, font colour, borders around the cell, a coloured background for the cell, etc. In addition, we may change the width of a column and the height of a row, and text may be centred over a number of cells. You may format cells one-by-one or, by first selecting a number of cells, all the cells in a range may be formatted at one time.

Clearly the Formatting toolbar provides many tools to change the appearance of a cell. If you let the pointer linger over a tool icon, a tooltip will appear telling you the purpose of the tool. You should use this method to identify the tools to change the font typeface, size and style (bold, italic and underlined). In the same way, find the three tools to change alignment.

Each of the tools which add borders, change the font colour and add a coloured background (pattern), has a small V beside it to indicate that the tool leads to a dialog box. Note that the border tool provides only black borders, below we see how to get coloured ones. Recall that the tools are a subset of the menu commands.

Other tools on the Formatting toolbar may be used to change how numeric values are displayed. Locate the Increase decimals and the Decrease decimals tool, and the tools to change the display to currency, as a value with thousand separators, or as a percentage.

6 Getting Started with Excel

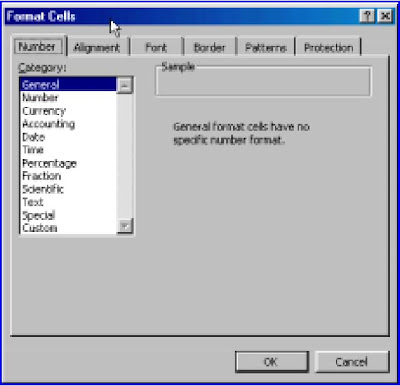
The menu command Format|Cells opens up the dialog box shown in Figure 6. From the Number tab one can set the format for numbers. The default setting is called General. You may wish to experiment with the Fixed and the Currency setting. If you click on the Fraction item you will see that it is possible to have fractional values displayed as quarters, eighths, etc.

Figure 6

The command Format|Column may be used to alter the width of a column. The default width is 8.38 units. A group of columns may be altered by selecting them in the column heading row before opening the Format|Column dialog. One of the most useful items on this dialog is the AutoFit Selection which makes the columns just the right width to hold their contents. If a column is given a width that is too small to hold a numeric value, the value will be displayed as ########. The solution is to (a) widen the cell and/or (b) display the value with fewer decimals if possible.

To experiment with formatting, make the worksheet shown in Figure 7. The vertical text was typed in normally and the cells were formatted with Format|Cells and opening the Alignment tab. The columns with this text were formatted for AutoFit. Using Tools|Options, and opening the View tab, the gridlines were removed from this worksheet.

Training completed

Cash register

Customer inquiry

Inventory check

Damian

x

x

Jo

x

x

Justin

x

Nichola

x

x

Simon

x

x

Tim

x

x

x

Ms Excel - Cell References and Entries

Cell References

To refer to a specific cell we use a cell reference. This is a combination of the column heading and the row number. The cell at the top left, which is at the intersection of column A and row 1, has a cell address of A1. The cell below is A2 while the cell to the right is B1. This method of naming cells using the column letter is called the A1 method. To reference a cell on another sheet of the same workbook, we use the form Sheet2!B4 – note the exclamation mark. To reference a cell in another workbook we can use the form 'C:\My Documents\[Book2.xls]Sheet1'!$A$1. We discuss the dollar signs in a cell reference later in this chapter.

Cell Entries

A cell may contain data or a formula. A data entry may be: a number, text (sometimes called labels) or a date. Formulas begin with an equal sign (=). We discuss formulas in detail in the next unit.

You may wish to experiment by making the worksheet shown in Figure 4. Type the entries in cell A1, C1, G1 and in row 2. For example, with A1 as the active cell, type the word Text and press the R key to complete the entry. We will discuss other ways of completing a entry later. Click on C1 and enter the next piece of data.

A

B

C

D

E

F

G

1

Text

This is an example of a long text entry

123456789

2

123

1.5

1.55

1 1/2

1.23457E+14


Figure 4

A number of observations may be made about how entries are initially treated. Later we

will discuss how formatting may be used to change the appearance.

1) Text is left aligned by default. By this we mean that on a newly opened worksheet any text typed into a cell will be placed to the left within the cell. The alignment may be changed by formatting the cell.

2) By default, numbers are left aligned.

3) Text can overflow into empty adjacent cells as shown by the entry in C2. If you type anything in D2, only part of C2's entry will be visible in the cell but all of it will be visible in the Formula bar.

4) When a large number (not too large) is entered, the column automatically widens to accommodate all the digits.

5) Very large numbers (the value typed into G2 was 123456789123456) are converted to exponential (sometimes called scientific) notation. The displayed value 1.23457E+14 means the same as 1.234567 × 10¹⁴. In the next unit we discuss Excel’s precision.

6) A whole number can have no more with than 15 digits. You are unlikely to be working with numbers that large. Objects we often call numbers are really just a string of digits. For example, phone numbers and account numbers are not real numbers in that we never perform arithmetic operations on them. In these cases it is better to enter the value by first typing a single quote (it is found on the key next to R). This quote mark will not be displayed in the cell but will cause the entry to be treated as text.

7) By default, Excel does not display what it considers to be insignificant digits. Thus if you type 1.50 in B2, the value 1.5 will be displayed in the cell and in the formula bar. Again, formatting can be used to change this.

8) Fractions may be entered as in D2. Note there is a space between the 1 and the 1/2. If you wish to enter a fraction (for example, 1/2) without a whole number, you must enter it with a preceding 0 followed by a space (e.g. 0 1/2). The zero will not be displayed when the entry is completed. In all cases, the values displayed in the Formula bar will be in decimal form (e.g. 1.5, or 0.5).

9) To evaluate a number in fractional notations, enter it as a formula. Thus to display the result of 1½ + 3¾ enter = 1+1/2+3+3/4. See the next unit for more on formulas.

10) Improper fractions are converted on entry. Thus 1 4/8 will be converted to 1 1/2. In certain cases (when the denominator is 2, 4, 8, 16, 10 or 100) we may format the cell to overcome this.

11) If you enter something like 4/12 without a leading zero, Excel will take this to mean a date – either 4 December or 12 April depending on your Regional Setting. We will not be discussing dates in this supplement.

We indicated above that you need to let Excel know when you have finished entering something in a cell and recommended the use of the R key. This is not the only way. Any of the navigation keys (B, L , R , T) and T may be used. Alternatively, you may click the Tin the Formula bar – this is displayed only while a cell entry is being made or edited. Do not get into the bad habit of clicking the mouse on another cell to complete an entry. While this will work when you are entering data it will cause you grief when working with formulas.

Ms Excel - Toolbars

Toolbars

As with all Windows applications, the toolbars provide quick access to the more frequently used menu commands. That is to say, the commands available from toolbars are a subset of the menu commands. In Excel2000 the Standard and the Formatting toolbars are docked together on one row by default. This means that only part of each toolbar is visible. To see the hidden part, click on the double arrow. If you prefer to have the toolbars on separate rows, open the Customize dialog box as explained above and clear the check mark from the box labelled Standard and Formatting toolbars share one row.

The amount of space allocated to each toolbar when they share a row may be changed. With the mouse, click on the vertical bar to the right of the first double arrow and drag it to one side.


Microsoft Excel Menu Commands

Menu commands

The menus in Excel 2000 are similar to menus in other Windows applications. However, as with all the Microsoft Office 2000 products there is a small difference from earlier versions: when you open a menu item an abbreviated version is displayed (Figure 2.)

Figure 2

Getting Started with Excel 3


Figure 3

The menu shows the commonly used and the most recently used commands. The entire menu is displayed if you click on the down arrow at the bottom of the menu. If your version of Excel is so configured, the full menu will also appear after a short delay. To configure Excel, either use the command Tools|Customize or right click on the menu bar and select the Customize item. In either case, the Customize dialog box is opened. If you move to the Option tag, the dialog box resembles Figure 3. To have all the commands displayed, clear the check mark from the Menus show recently used commands first box. Beaware that this action will affect other Microsoft Office 2000 application on your PC.

Menu commands may be accessed by clicking on the required item. Alternatively, you may hold down the A key and press the key corresponding to the underscored letter in the menu item. Thus the File menu is opened with A+F. A third method is available for other commands. If you open the File menu you will see to the right of the Save item the shortcut CTRL+S. This means that the key commination C+S will save the current file – there is no need to open the File menu for this to work. The shortcuts for copy and paste (C+C and C+V) are very useful to know.

Student resources for Quantitative Approaches in Business Studies

Student resources
Excel supplement
The Excel supplement is a tutorial for Microsoft Excel. It was written by Bernard V Liengme specially as a supplement to Quantitative Approaches in Business Studies by Clare Morris.

The table below explains how the units of the tutorial link to the chapters of Quantitative Approaches in Business Studies. The student is advised to read the first two units carefully. The other units may be read in any order.

The units are in Adobe Acrobat format (PDF). The Adobe Acrobat Reader is available FREE from Adobe Systems Incorporated. The workbooks named below are in Excel 97/2000 format. Right-click on any file and choose Save As to save the file to your hard disk.

Tutorial Units Quantitative Approaches in Business Studies Chapters
1 Getting Started with Microsoft Excel 2 Spreadsheets and other computer-based resources
2 Formulas and Functions 2 Spreadsheets and other computer-based resources
3 Solving Equations 1 Tools of the Trade
19 Linear Programming
4 Creating Charts 5 Presenting the Figures
5 Regression Analysis 13 Looking for Connections
14 Spotting the Relationship
15 Multiple Regression
6 Financial Calculations 18 Allowing for Interest
7 Descriptive Statistics
Workbook: STATISTICS1
6 Summarising the Figures
8 Statistical Distributions
Workbooks: PROBABILITY, NORMALDISTA, NORMALDISTB & NORMALDISTC
9 Patterns of Probability
9 Hypothesis Testing
Workbooks: HYPOTHESIS and CHISQUARED
10 Estimating from Samples
11 Checking a Theory

Every effort has been made to be accurate but if you believe you have found an error please let the author of the supplement, Bernard Liengme, know. As stated above, the workbooks are in Excel 97/2000 format; files in Excel 5/95 format are available from the author upon request. The author will be pleased to answer questions on Excel but please make them clear and specific.

Bernard V Liengme


Copyright © 1995-2008, Pearson Education, Inc. Legal and Privacy Terms

OfficeUsers.ORG Editorials